This guide reframes Metrics for SEO around revenue, not activity. It defines core categories — traffic and acquisition from Search Console and GA4, visibility and rankings, referring domains, Core Web Vitals, and technical health — then shows how to wire organic conversion rate, revenue attribution, and assisted conversions in GA4. It concludes that zero-click search demands a four-metric permanent dashboard built on key events.
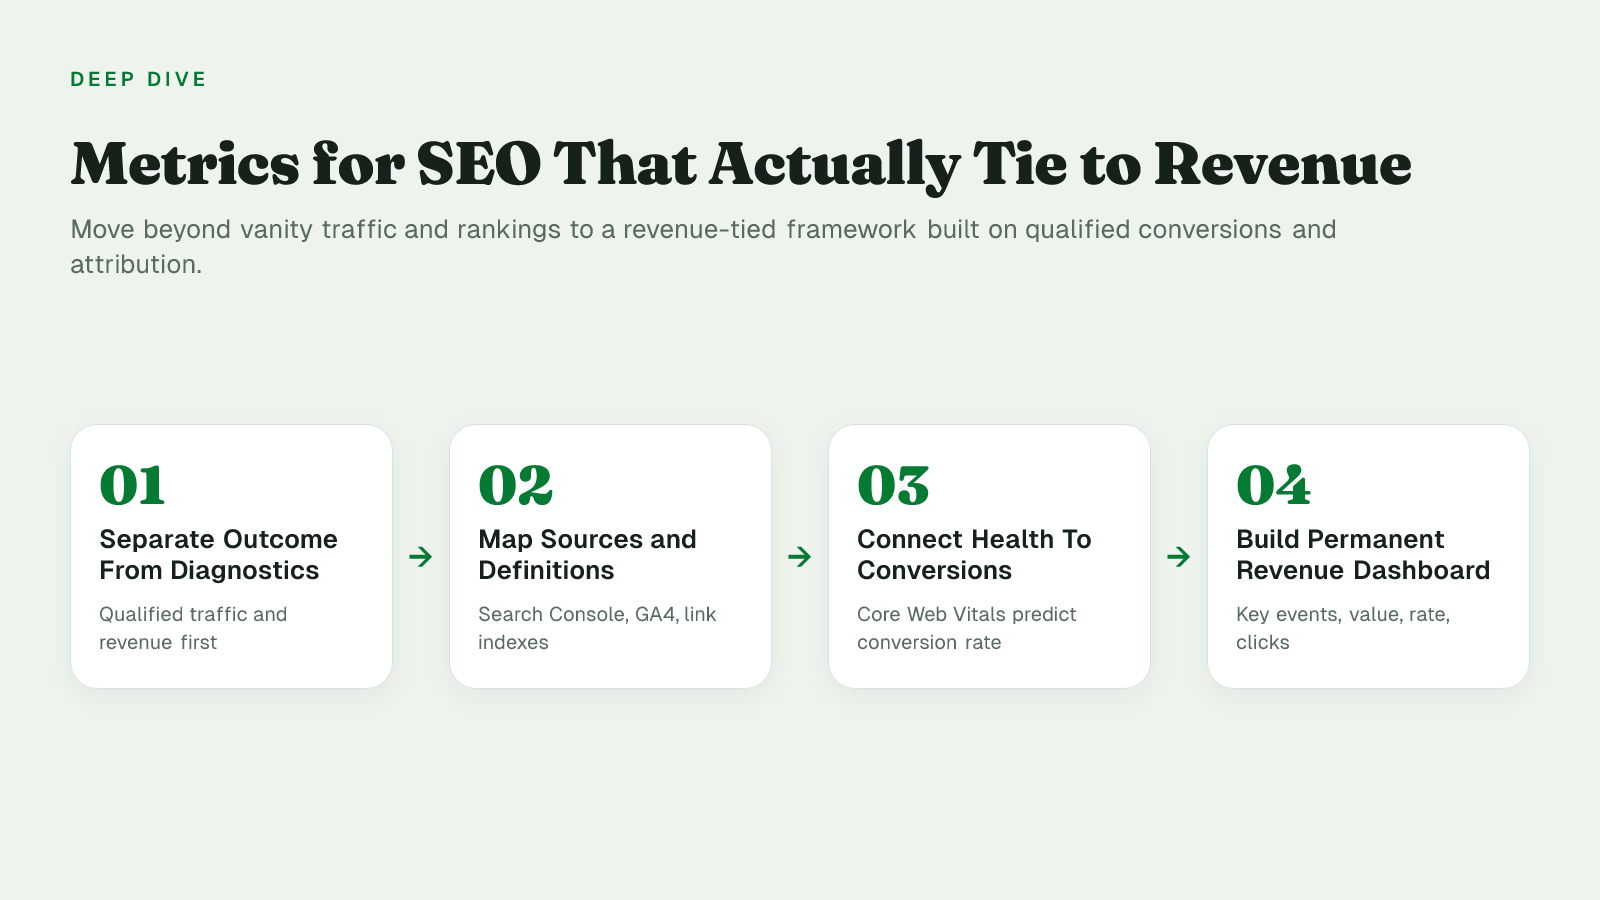
The metrics that matter for SEO fall into two groups: diagnostic signals (traffic, rankings, impressions, backlinks) that show activity, and outcome signals (organic conversion rate, revenue attributed to organic, assisted conversions) that prove business value. Track both, but report outcome metrics first, since diagnostics only explain why the outcome moved.
When HubSpot rebuilt its content analytics, it dropped raw traffic totals from the executive view and kept four SEO metrics that tie directly to pipeline: qualified organic traffic, organic conversion rate, revenue attributed to organic, and assisted conversions from organic journeys.
Those four matter because they measure outcome, not activity. Qualified organic traffic filters for visitors who match your ideal customer profile or show buying intent, rather than every session. Organic conversion rate shows what percentage completes a defined business action like a trial, demo request, or purchase. Revenue attributed to organic connects the channel to dollars in your CRM or payments system, and assisted organic conversions capture influence even when search is not the last click. The rest (raw sessions, total keyword count, average position in isolation) are diagnostic. They help you troubleshoot, but they do not prove business value on their own.
Most dashboards invert that order. Teams report on traffic volume and ranking breadth because those numbers move fast and look positive, while conversion and revenue lag and require proper attribution setup. The result is reporting that feels good but cannot answer whether SEO produced more trials, demos, or purchases. A revenue-tied framework fixes that by putting outcome metrics first and using diagnostic metrics second to explain why outcome moved.
The categories below cover what any serious stack tracks: traffic and visibility, authority signals, technical health and user experience, and conversion and business impact. Each has its place, but only the last group tells you if SEO paid for itself. The next question is how each category is actually measured and what tool produces it.
Trusted numbers for clicks, impressions, rankings, and backlinks come from three places: Google Search Console for search-side metrics, GA4 for on-site organic sessions, and independent link indexes for referring-domain authority. Knowing which tool owns which definition stops you from mixing incompatible reports.
Google Search Console defines the search-side of traffic in its Performance report definitions: an Impression is how often someone saw a link to your site on Google, a Click is how often someone clicked a link from Google to your site, and CTR is the calculation of clicks ÷ impressions. These three are event-level counts tied to Google Search results, not to your analytics.
On-site organic traffic is a different count. In GA4, Organic Search is the default channel through which users arrive via non-ad links in organic-search results, a category that includes clicks surfaced through Google's AI-generated search features. That definition matters because GA4 classifies sessions by source, medium, and its maintained rule set, while Search Console counts clicks before any bot filtering, consent mode, or redirect loss on your site. Use Search Console as truth for demand and click opportunity, GA4 as truth for landed sessions and downstream behavior. If the two diverge, check filters, canonicalization, and channel grouping first.
Keyword rank position and average position both come from Search Console. Search Console states that (average) Position is a relative ranking where 1 is the topmost position, and the value shown is the topmost position occupied by a link to your property or page, averaged across all queries in which your property appeared.
That averaging is why average position misleads. A page ranking #2 for 1,000 impressions and #20 once shows as ~2, not 11, because it is weighted by impressions. Position 11 itself can mean top of page 2, a right-rail knowledge panel prominent spot, or a second row in image results. Track trend and distribution by query and page rather than one blended average.
Indexed pages is the third visibility metric. Its source of truth is Search Console's Pages report under Indexing, not a third-party rank tracker. If a URL is not indexed, it cannot generate impressions or clicks, regardless of keyword intent. Monitor indexed vs. not indexed counts and the specific reasons (crawled - currently not indexed, duplicate without user-selected canonical) before chasing rank changes.
Referring domains is the count of unique domains linking to you. Backlink velocity is how fast new referring domains appear or disappear over time. Backlink quality is whether those domains are topically relevant, have real traffic, and link from primary content rather than footer, sitewide, or UGC-injected blocks.
The authoritative source for this family is not Google. Google's Links report in Search Console shows a sample for verification, but industry practice uses independent link-graph crawlers such as Ahrefs or Semrush for historical velocity, anchor distribution, and toxicity patterns. Their indexes differ, so compare trends within one tool, not absolute counts across tools.
Raw backlink count overstates authority. One new link from a relevant domain that already ranks for your target topic typically moves visibility more than 100 new low-relevance links, and unnatural spikes in velocity often correlate with spam or scraped attribution rather than earned coverage. Audit referring-domain quality first, then watch for sustained referring-domain growth without loss of existing quality domains.
These three layers tie SEO to revenue only when you treat speed and indexability as predictors and conversions as proof. The common mistake is reporting a green Core Web Vitals score or a higher ranking as a win without attaching an organic conversion rate or lead value.
Google defines three Core Web Vitals as the subset of Web Vitals that should be measured by all site owners and are surfaced across Google tools. Largest Contentful Paint measures loading performance and to provide a good user experience should occur within 2.5 seconds of when the page first starts loading. Interaction to Next Paint measures interactivity and pages should have an INP of 200 milliseconds or less. Cumulative Layout Shift measures visual stability and pages should maintain a CLS of 0.1 or less.
Tools assess compliance at the 75th percentile of page loads, segmented by mobile and desktop. That percentile method is intentional: it filters outliers and requires most real users to meet the target. The same methodology defines poor thresholds at LCP greater than 4000 ms, INP greater than 500 ms, and CLS greater than 0.25.
These are leading indicators. Fixing LCP, INP, and CLS does not register revenue today, but it predicts whether Google can efficiently render and serve your pages and whether users will stay long enough to convert. Track them in Search Console's Core Web Vitals report, PageSpeed Insights, and the Chrome User Experience Report, not as vanity grades but as pass/fail gates for shipping.
Crawl and index coverage is the next leading layer. Watch Search Console's Pages report for indexed vs. not indexed, server errors, soft 404s, and discovered but not indexed. A rising error count predicts future ranking loss before traffic moves.
Dwell time, bounce rate, and engaged sessions from GA4 are intermediate diagnostics. They do not tie directly to revenue, but a pattern of short dwell after an organic click signals mismatch between intent and content, even if rankings hold.
The business-impact layer is lagging by design: it confirms what already happened.
Leading vs. lagging in practice: Core Web Vitals and crawl health predict future organic performance. Engagement metrics diagnose content fit. Organic conversion rate, revenue, and lead value validate whether that future performance produced business value. No dashboard should show a leading metric without its paired lagging metric.
Raw traffic or a higher average position without an organic conversion attached is not a success metric; it is an activity log.
The table below consolidates traffic, visibility, authority, UX and conversion metrics into one reference, applying Google Search Console's definitions directly: clicks are counted as user clicks from results, CTR is click count divided by impression count, and Core Web Vitals requires INP under 200 ms for a good experience. Primary source shows where the number is measured authoritatively today; signal type separates leading indicators you can influence this sprint from lagging and vanity indicators you watch monthly. For baseline definitions, see the Performance report documentation in Google Search Console and Core Web Vitals guidance.
| Metric | What It Measures | Primary Source/Tool | Leading or Lagging Indicator |
|---|---|---|---|
| Organic Traffic | Sessions or users from unpaid search | GA4 | Lagging – business outcome |
| Clicks | Clicks from Search results to your site | Search Console Performance report | Lagging – visibility converted to visit |
| Impressions | How often your site appeared in Search | Search Console Performance report | Leading – raw visibility |
| CTR | clicks divided by impressions | Search Console Performance report | Leading – snippet and intent match |
| Average Position | Average position of topmost result from site | Search Console Performance report | Leading, but vanity when averaged blindly |
| Referring Domains / Link Quality | Count and quality of unique linking domains | Ahrefs / Semrush / Search Console Links | Leading – predicts authority growth |
| LCP (Largest Contentful Paint) | Load time of largest visible content element | PageSpeed Insights / CrUX | Leading – technical health |
| INP (Interaction to Next Paint) | Interaction-to-visual-response delay; good is under 200ms | PageSpeed Insights / CrUX | Leading – technical health |
| CLS (Cumulative Layout Shift) | Unexpected layout movement score | PageSpeed Insights / CrUX | Leading – technical health |
| Index Coverage / Crawl Errors | Indexed vs. excluded pages from crawl and canonical issues | Search Console Indexing + Crawl Stats | Leading – prerequisite to any visibility |
| Organic Conversions | Form fills, purchases, qualified actions attributed to organic | GA4 Conversions | Lagging – revenue-tied outcome |
Use leading metrics to diagnose why lagging metrics moved. If organic conversions fall, trace back through INP, index coverage, average position and CTR before questioning demand. If impressions rise but clicks do not, treat average position and CTR as the immediate levers, not organic traffic as a whole.
Zero-click search and AI-generated answer boxes have made organic traffic and CTR unreliable as standalone success metrics. You open your report on Monday, clicks are flat while Search Console impressions climb. The instinct is to read that as good exposure but weak performance. In an AI-driven SERP, that read is often wrong.
HarperFlow publishes highly structured articles featuring FAQs, data tables, and direct-answer blocks that meet the rigorous citation standards required by AI search engines. By continuously auditing and improving your content through AI answer analytics, HarperFlow helps your site build long-term authority and visibility that outlasts ad-dependent strategies.
Documented clickstream panels show the shift. Analysis of Similarweb panels published by SparkToro found that a majority of Google searches ended without a click from January to April 2026, continuing an increase from 2024, which the report attributes to AI-generated summaries now appearing on more than 20% of searches. For queries that do trigger such a summary, Seer Interactive measured a decline in organic click-through rates since mid-2024, alongside a drop in paid CTR on those same informational queries, as reported by Search Engine Land.
This changes what operators should trust. Impressions can rise while clicks fall because the answer was consumed on the SERP itself. Ranking in the top three no longer guarantees CTR stability when an AI box answers above you.
Teams are adding three signals that sit outside classic SEO dashboards, with different maturity levels:
Referral traffic from AI assistants is measurable today. GA4 already segments referrers like chat.openai.com, perplexity.ai, and claude.ai. Tagging them as AI referrals gives you a real, if small, demand line you can put beside organic.
Brand or entity mention frequency inside AI-generated answers is emerging, not standardized. No GA4 report shows it. Early options require prompt testing at scale or specialized trackers that sample ChatGPT, Perplexity, and others for target queries and count citations. Results are directional, not auditable like Search Console.
Share of voice in AI answers for your core queries is also emerging. You can manually test a set of buying or informational prompts weekly, log which brands or domains are cited, and calculate your share versus competitors. Consistency matters more than absolute counts. The framework is described in Similarweb's zero-click marketing overview.
Publishing practice is adapting to this reality. Structuring articles around multiple authoritative sources is a content operations choice, not a new analytics metric, but it raises the odds of being cited in AI-generated answers, one reason HarperFlow builds its automated publishing around that principle.
A flat or declining organic-traffic line does not automatically mean declining visibility anymore. In many categories, it means visibility moved into AI-generated summaries and chat answers where no click is recorded.
A measurement stack that won't go stale anchors SEO reporting to organic key events and conversion value in GA4, with Search Console clicks as the weekly health check, regardless of business model. Those four signals connect search activity to business outcomes and survive when rankings fluctuate. Emerging AI-answer signals matter, but they only help if they're folded into a routine that's actually followed.
Keep this core on one page. Everything else is diagnostic:
1. Organic key events (count) - Weekly. The events you marked as business-critical, like generate_lead, demo request, purchase. GA4 documents that conversions in GA4 are created from a Google Analytics event and provide a consistent way of measuring important actions across Analytics and Ads. If this drops, nothing else matters.
2. Organic conversion value / revenue - Weekly, with monthly rollup. Same key events, but measured in dollars or qualified pipeline. This forces tradeoffs between volume and quality.
3. Conversion rate for organic sessions - Monthly. Key events divided by organic sessions. It isolates whether you have a traffic problem or a page/offer problem.
4. Search Console clicks vs. impressions - Weekly for clicks, monthly for trend. Use it as a leading health check before revenue moves. If impressions rise while clicks and key events fall, you are feeling zero-click impact, not seasonality.
Review cadence that holds:
Run this audit against your current dashboard:
Treat classic SERP metrics as necessary but no longer sufficient. Rankings and raw organic traffic still catch technical breaks, but they no longer explain revenue on their own. Teams that wait for perfect tooling to track AI-answer visibility will wait too long; start tracking the imperfect signals now so you have a baseline when tooling improves. That discipline is easier when publishing itself is measurement-ready: content grounded in multiple authoritative sources is already structured for both classic crawl and AI citation, which makes your dashboard inputs more reliable without becoming a cure-all.
Search Console counts every click from Google to your site before on-site filtering, while GA4 counts only landed sessions that pass its Organic Search channel rules. Check consent mode, redirects, canonicals, and channel grouping when they diverge.
In GA4 mark only two to three revenue actions as key events, then divide key events by organic sessions or organic users for traffic filtered to default channel group = Organic Search. A key event measures an action particularly important to business success, so avoid counting micro-events.
Search Console defines average position as the average of the topmost position your property occupied, where 1 is topmost. One query with many impressions can dominate the average, so track position distribution by query and page and watch trend, not a single blended number.
One new relevant domain that already ranks for your topic typically influences visibility more than dozens of low relevance links. Track unique referring domains for quality and growth within one index like Ahrefs or Semrush, not absolute backlink totals across tools.
For a good experience Google uses LCP within 2.5 seconds, INP of 200 milliseconds or less, and CLS of 0.1 or less, evaluated at the 75th percentile. Poor is over 4000 ms for LCP, 500 ms for INP, and 0.25 for CLS.
GA4 already sees referrers like chat.openai.com, perplexity.ai, and claude.ai in traffic acquisition. Create a custom channel grouping or segment for them so you can report AI referrals alongside organic key events, even while citation tracking stays directional.
CTR is clicks ÷ impressions or click count divided by impression count in the Performance report. Use it as a leading indicator of snippet fit and intent match, not as a revenue outcome by itself.
If a chart reports average position, raw clicks, or impressions without tying to a GA4 key event or conversion value, label it diagnostic. Also check ownership, review dates, and whether total backlinks are reported without referring domain quality.
Related articles
HarperFlow publishes highly structured articles featuring FAQs, data tables, and direct-answer blocks that meet the rigorous citation standards required by AI search engines. By continuously auditing and improving your content through AI answer analytics, HarperFlow helps your site build long-term authority and visibility that outlasts ad-dependent strategies.
Start Your Trial TodayLover of all things automation and all things content.
Your privacy
Necessary storage keeps the site secure and working. With permission, analytics helps us improve it and marketing tools measure campaigns. Google can still send limited cookieless signals when optional storage is off. Read our Privacy Policy.
Your browser sends a privacy signal (Global Privacy Control), so optional technologies start off — your choice here takes precedence.
Privacy choices
Necessary storage supports security, consent, and the features you request. Optional categories can be changed at any time.
Security, fraud prevention, consent preferences, form delivery, and popup suppression.
Your browser sends a Global Privacy Control signal, so optional technologies start off by default. Your explicit choice here takes precedence.
A practical AEO/GEO manual for making your Webflow site clearer, better sourced, and easier for answer engines to use—without gimmicks or guarantees.
Find gaps in discovery, extraction, evidence, authority, and freshness
Use evidence patterns, briefs, and fill-in worksheets
Run a focused 30-day AEO/GEO operating sprint
We’ve emailed your copy. It should arrive within a few minutes.
If it is not in your inbox within a few minutes, check spam or promotions.